Wednesday, June 18, 2014
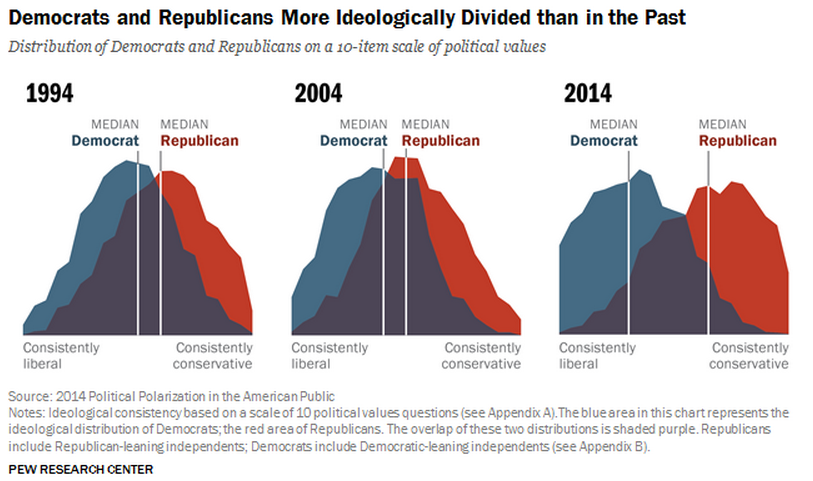
21 Charts That Explain How America is Changing
Subscribe to:
Post Comments (Atom)
This is a webpage written by high school teachers for those who teach US and comparative government and want to find online content as well as technology that you can use in the classroom.

 told me about it. It is an entirely free AP book complete with pictures and loads as quickly as others out there. It is put out by Flat Knowledge. If nothing else I would tell your students about it for an additional resource. </div>)
No comments:
Post a Comment